High-Conductivity Thermal Pads (15–18 W/mK)
Server pads at 15–18 W/mK only pay off when the bond line is thin and the pressure is real. Read the datasheet, size hardness, set assembly pressure, qualify.
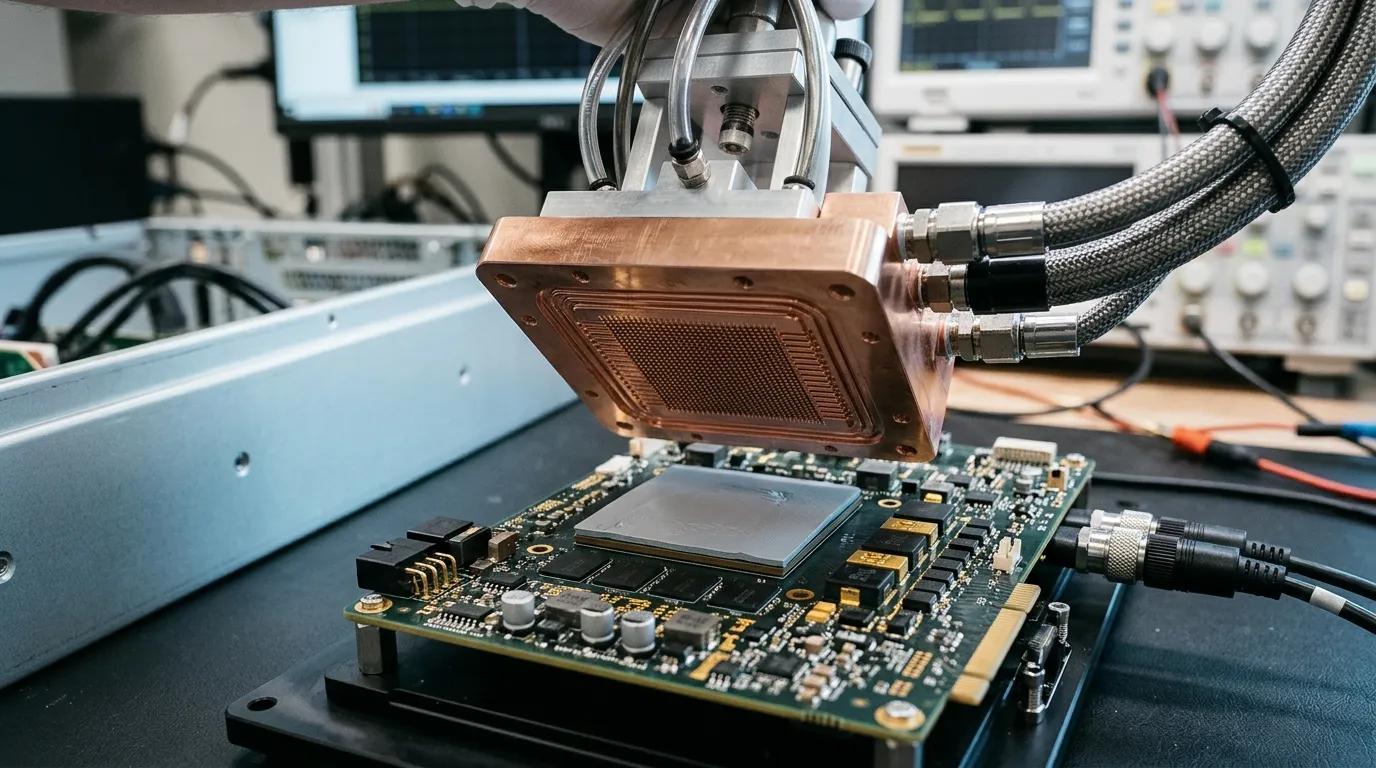
Why a 700 W part forces the question
The cold plate is torqued to the drawing. The pad is the expensive one this time, 16 W/mK instead of the 8 W/mK grade the previous build used. And the delta between coolant inlet and GPU hotspot barely moves. The team concludes the pad was oversold — usually before anyone checks whether the interface was thin enough, flat enough and loaded hard enough for the extra conductivity to show up at all.
That is the trap with high-conductivity thermal pads in servers. Between roughly 6 and 12 W/mK, a step up almost always reads as progress — the thermal path is filler-dominated and the supply chain treats the number as a quality score. Between 12 and 18 W/mK you are no longer buying a better material in any absolute sense; you are buying a narrower set of conditions under which it works, and paying for filler volume that only becomes a lower junction temperature when the bond line is thin and the contact is real.
The stakes are easy to size. Take a 700 W accelerator (NVIDIA rates the H100 SXM module at up to 700 W) with a 60 × 60 mm package. Interface resistance converts to temperature like this:
ΔT = Q × R″ ÷ A, with Q in watts, R″ in °C·in²/W, A in in²
At 700 W over 5.6 in², every 0.01 °C·in²/W of interface resistance is worth about 1.25 °C of junction temperature. A 0.5 mm interface that measures 0.23 °C·in²/W costs you close to 30 °C before the cold plate has done anything. That is why this grade ladder matters on a server and barely matters on a set-top box.
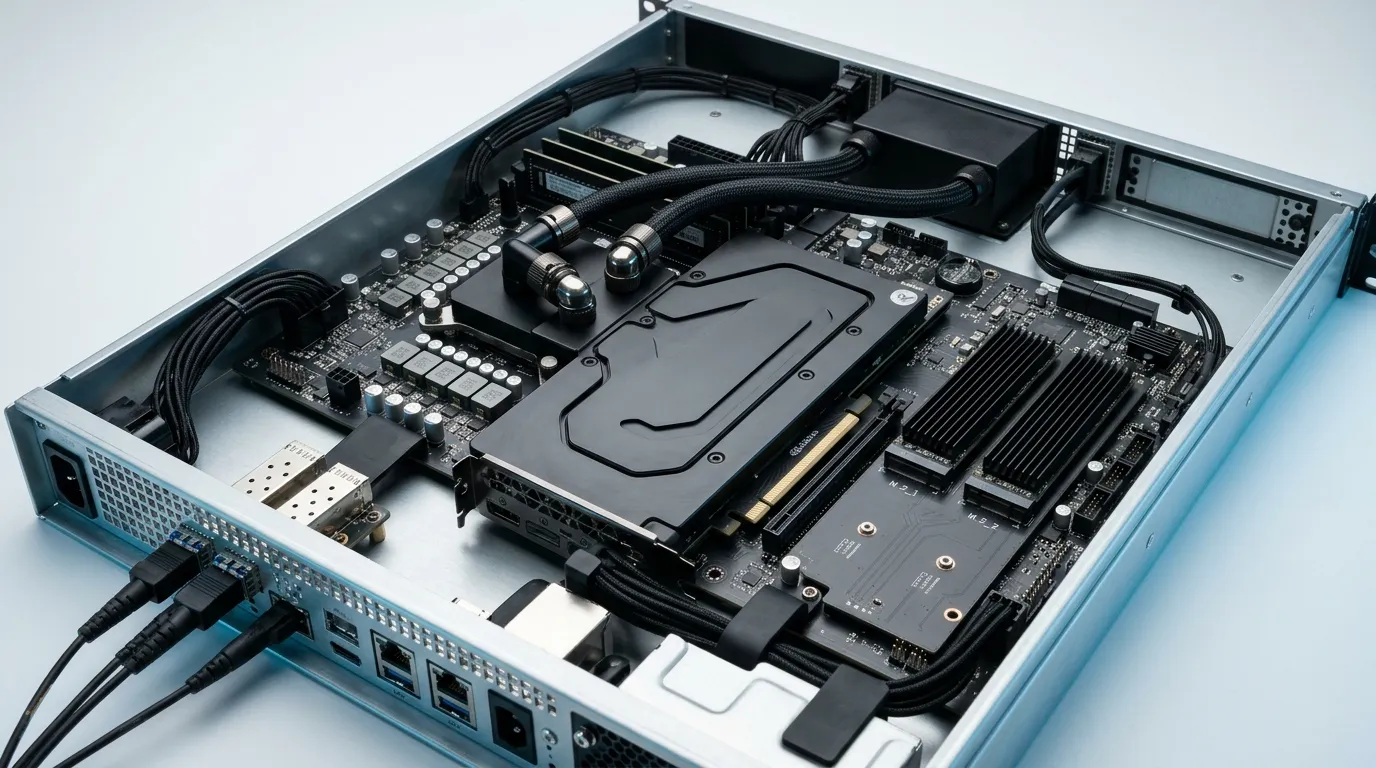
A single node now asks one material family to serve four very different interfaces: the accelerator package under a cold plate, the CPU lid, the M.2 SSD controllers, the optical transceiver cages and the VRM stages. They share a grade ladder and not much else — the same 16 W/mK pad that rescues an HBM stack is usually the wrong answer over an optical module.
| Grade band | Where it usually lands in a server | Strength | What it costs |
|---|---|---|---|
| 1–5 W/mK | SSD controllers, optical cages, VRM, low-power NICs | Soft, cheap, forgiving of stack-up | Bulk resistance dominates above a 0.5 mm gap |
| 6–12 W/mK | CPU lids, DIMMs, mid-power accelerators | Wide compression window, easy to assemble | Needs a thick interface or high pressure to show its value |
| 15–18 W/mK | Accelerator packages under a cold plate, HBM stacks, high-flux lids | Lowest bulk term at a thin bond line | Harder compound, narrower window, higher price, tolerance-sensitive |
Where the scale actually sits: commodity pads cluster between 1 and 8 W/mK, and the 15–18 W/mK band this article covers sits at the top of that ladder. Above it the material class changes more often than the number — in-plane graphite and carbon fibre, or liquid metal, neither of which is a silicone pad in a different grade. Phase change film is the opposite trade rather than the next rung up: TIC®800, ZIITEK's own phase change series, runs 0.95–9.6 W/mK, and it earns its place on joint thickness — 25–75 µm — rather than on k. So the short answer to "what is the highest thermal conductivity" is not a single figure; it is a question about direction and class.
If you are still choosing between material families rather than grades, start with the data center and AI server thermal materials hub, and for the package-level view of HBM stacks and cold plates see thermal interface materials for AI hardware.
What high-conductivity thermal pads actually buy you
Interface resistance has three terms in series: the contact resistance into the pad, the bulk resistance through it, and the contact resistance out. The bulk term is the one your W/mK number controls:
R″ = (BLT × 1.55) ÷ k + R″c,in + R″c,out >BLT in mm, k in W/(m·K), R″ in °C·in²/W. The 1.55 is not a fudge factor: one millimetre of bond line divided by one W/(m·K) is 1.55 °C·in²/W, so a 0.25 mm line at 16 W/mK gives (0.25 × 1.55) ÷ 16 = 0.024 °C·in²/W.
Everything below lumps those two contact terms into a single 0.10 °C·in²/W — one constant covering both interfaces, not one constant per interface.
That structure is textbook — the same decomposition appears in Electronics Cooling's review of TIM behaviour, which also makes the point that raising conductivity flattens the total response, and does nothing if you bought it at the cost of contact resistance. Two consequences follow, and both are uncomfortable for a spec sheet that leads with k.
First, the bulk term shrinks as the bond line shrinks. At a 0.25 mm bond line, a 16 W/mK pad contributes about 0.024 °C·in²/W of bulk resistance. At 1.5 mm it contributes 0.145 — six times more. The same material, the same supplier, a completely different interface.
Second, the marginal return on k collapses as the bond line thins. The table below holds the two contact terms at a combined 0.10 °C·in²/W and computes total interface resistance from the formula above, conversion factor included — every figure in it is reproducible with a calculator. It is a first-order estimate, not a measurement, but the shape is what matters:
| Bond line | 6 W/mK | 12 W/mK | 16 W/mK | Gain, 12 → 16 |
|---|---|---|---|---|
| 0.25 mm | 0.165 | 0.132 | 0.124 | 6.1% |
| 0.50 mm | 0.229 | 0.165 | 0.148 | 9.8% |
| 1.00 mm | 0.358 | 0.229 | 0.197 | 14.1% |
| 1.50 mm | 0.488 | 0.294 | 0.245 | 16.5% |
Read the 0.5 mm row the way a program manager would: paying for the top grade in the family buys about a tenth of the interface resistance, which on the 700 W example above is roughly 2 °C. Read the 1.5 mm row and the same upgrade is worth about 6 °C. Now put either number next to what a 0.2 mm reduction in bond line buys at the 0.5 mm interface — about 3 °C at constant conductivity, for free, if the mechanical design allows it. On thin interfaces the gap is the cheaper lever; on thick ones the material starts to earn its price.
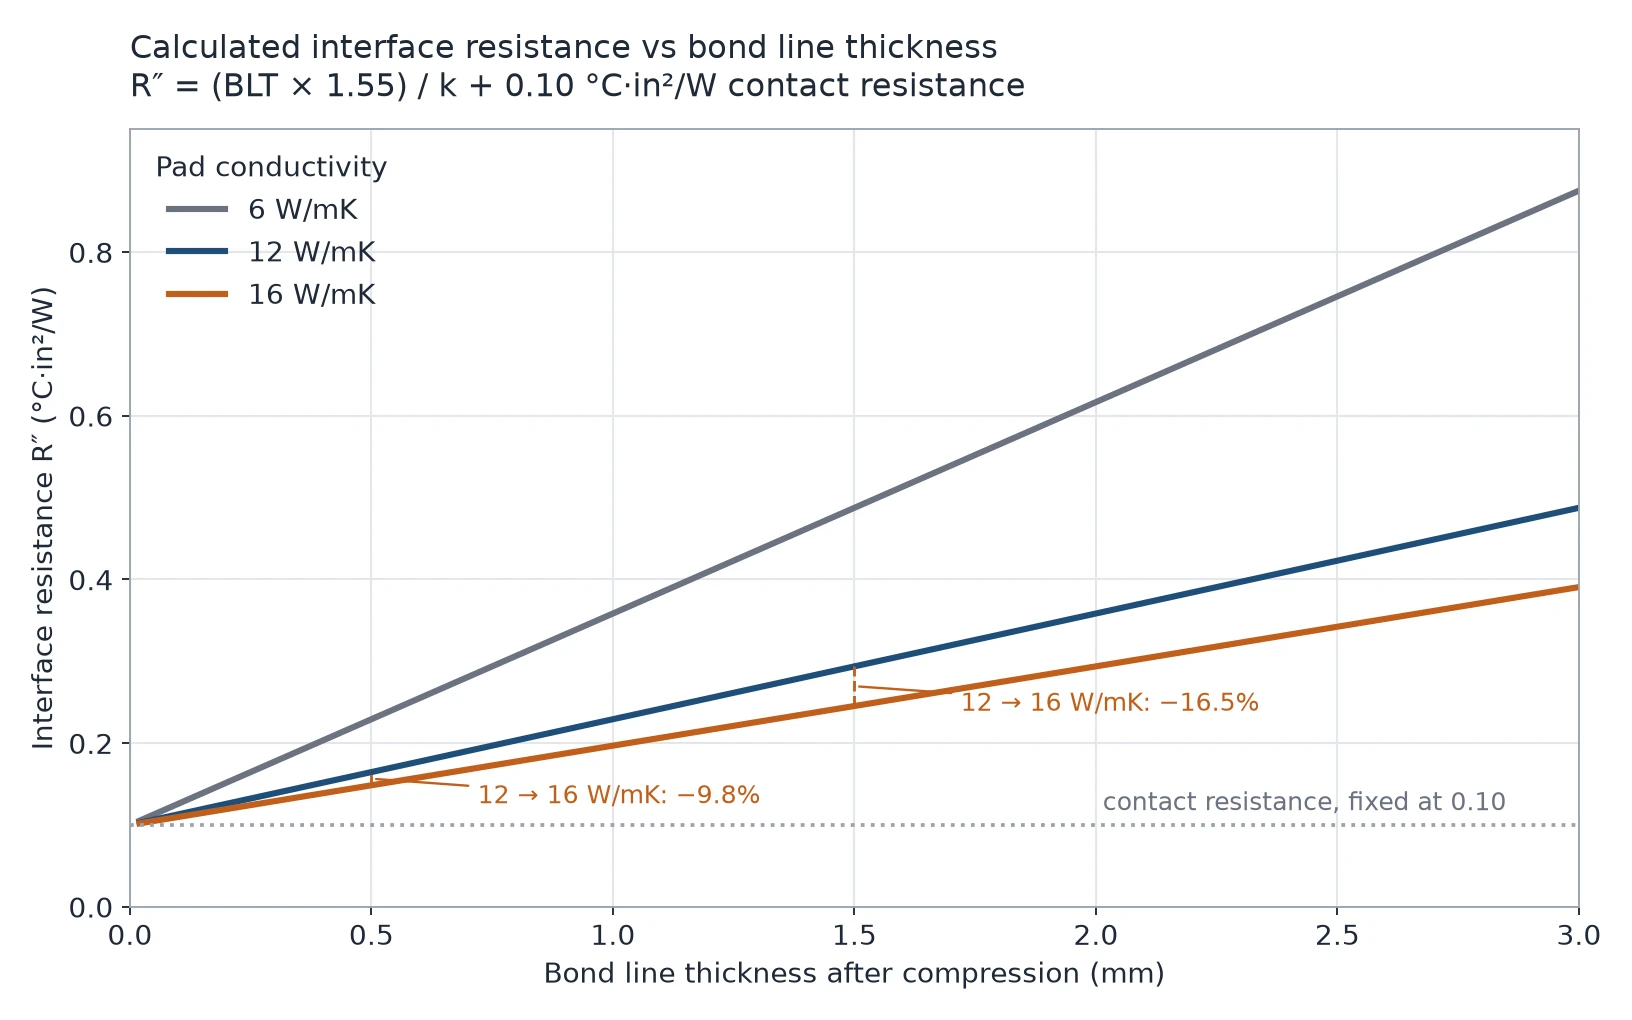
Which is the honest answer to the question engineers keep typing into search: no, a higher W/mK is not automatically better. It is better when the interface is thick, the pressure is adequate, and the surfaces are flat enough that contact resistance is not the dominant term. When contact resistance dominates, the expensive pad is a subsidy to your supplier.
For the difference between the resistance a datasheet implies and the impedance a real assembly produces, the distinction is set out in thermal resistance versus thermal impedance.
Step 1 — Read the datasheet in the right order
Most selection mistakes happen before anyone touches a sample, because the datasheet is read top-down and the headline number is at the top. Read it in this order instead.
1. Conductivity and its test method. A through-plane value quoted to ASTM D5470 is measured on a compressed sample between heated platens — the standard covers thermal transmission properties of thermally conductive electrical insulation materials. That is the number you can compare across suppliers. A value back-calculated from filler loading is not comparable to it, so ask which method produced the figure on the sheet in front of you.
2. Thermal impedance at a stated pressure and thickness. If the datasheet gives impedance, it must say at what compression and what pressure, otherwise it is unusable. An impedance quoted at 50 psi tells you nothing about a 15 psi retention scheme.
3. Thickness range and tolerance. Pads are supplied in steps, typically 0.25 mm up to 12 mm depending on the family, with a tolerance that is usually a percentage rather than an absolute. A ±10% tolerance on a 1 mm pad is ±0.1 mm — the same order as the compression you were planning to use.
4. Hardness and the compression curve. Shore OO per ASTM D2240 (typically quoted at 3 s / 30 s) plus deflection-versus-force data. Hardness alone is a poor predictor; the curve is what tells you whether your retention hardware can close the gap.
Two unit traps catch people out. Impedance in °C·in²/W converts to °C·cm²/W by multiplying by 6.45, so 0.15 °C·in²/W and 0.97 °C·cm²/W are the same interface — and the cm² figure is always the bigger number, so a sheet quoted that way can look six times worse than the part it describes. Convert both sides to one unit before you compare them. And conductivity direction matters: graphite and carbon-fibre pads conduct far better in-plane than through-plane, and carbon-fibre grades are typically not electrically insulating — a different material decision entirely, not a grade of the same decision.
Step 2 — Match hardness and compression window to your retention force
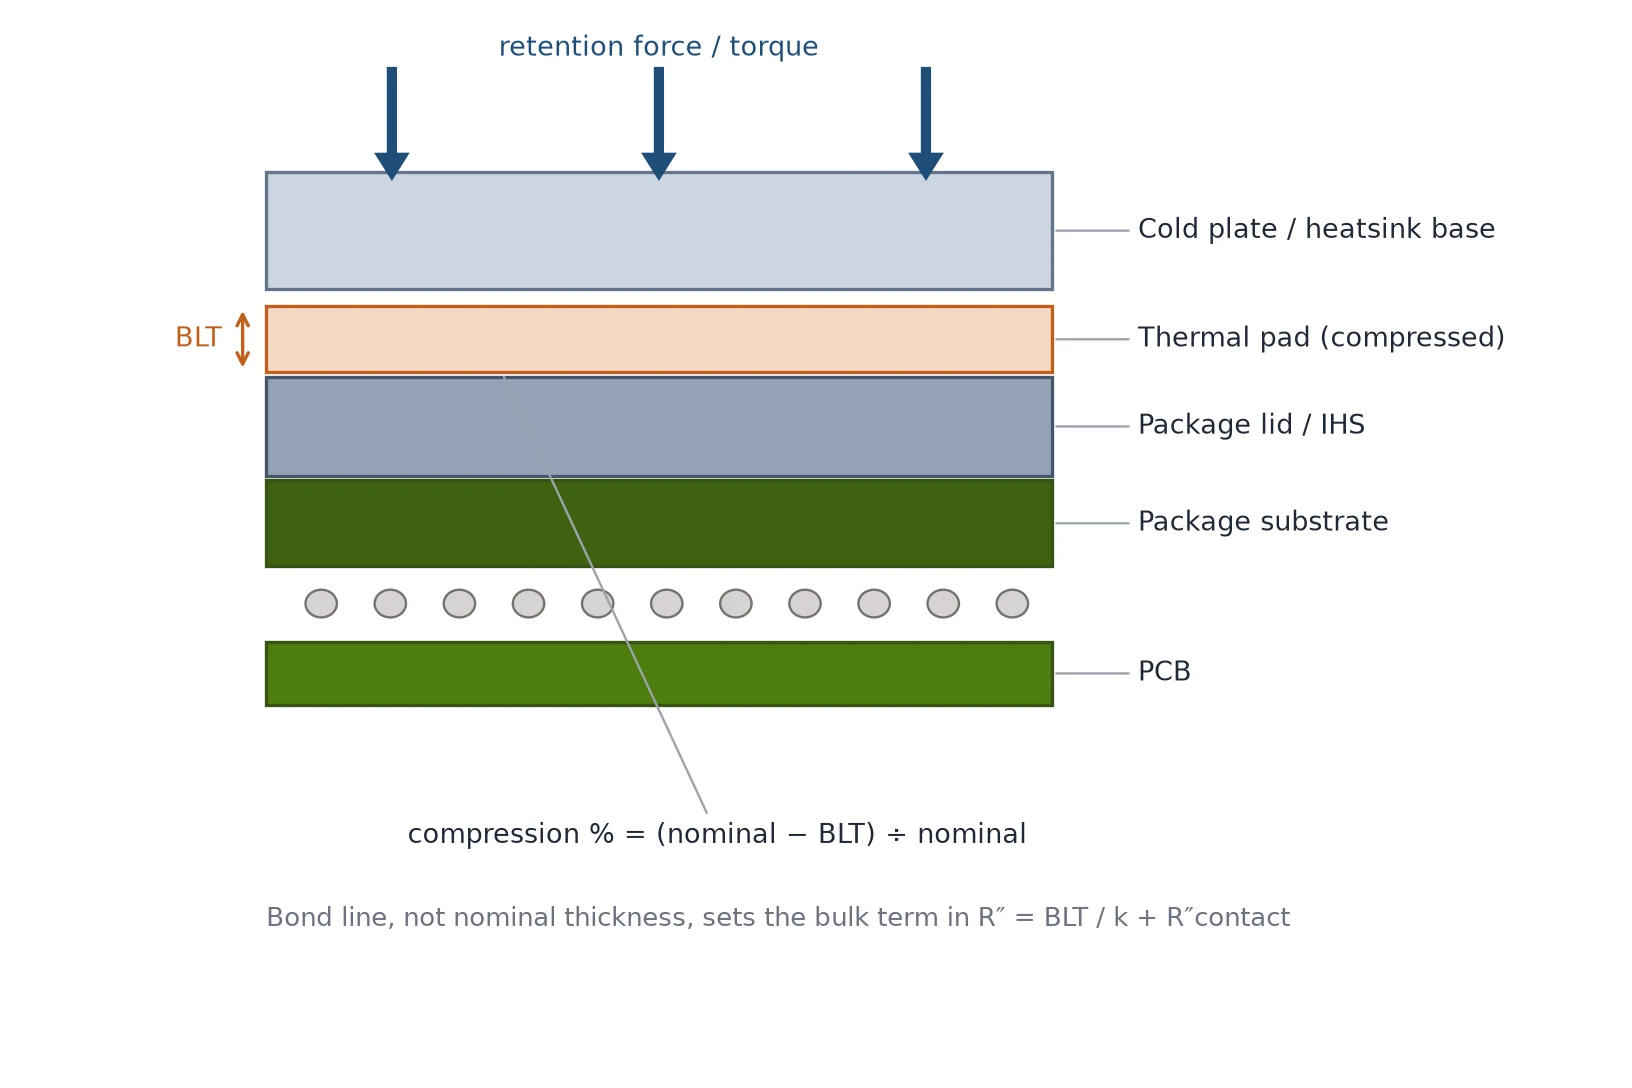
Here is the part the grade ladder hides. Getting to 15–18 W/mK means loading the silicone with ceramic filler until the filler network carries most of the heat. Filler volume adds modulus. The 16 W/mK grade is almost always harder, or more heavily engineered to stay soft, than the 8 W/mK grade it replaces — and a harder pad compresses less for the same force, which widens the effective bond line and hands back part of the resistance you just paid for.
Three numbers define the window:
- Compression at assembly — commonly 10–30% of nominal thickness for server pads, and the pad must reach it at the force your hardware can actually deliver.
- Available force — sum the spring or standoff load over the pad area. A 60 × 60 mm pad at 20 psi needs about 500 N; the same pad at 10 psi needs 250 N. Neither is exotic, but only one of them may match your retention clips.
- Stack-up tolerance — component height, board bow, cold-plate flatness and standoff tolerance. The pad has to work across the whole window, not at nominal.
This is where a single-conductivity supplier is a liability. ZIITEK's own ladder shows the two levers being pulled separately: TIF®800SE is quoted at 15.0 W/mK to ASTM D5470 at Shore OO 35 in 0.75–5.00 mm, while TIF®800TU is quoted at 16.0 W/mK with a deliberately gel-like, very soft compound aimed at HBM and optical assemblies where a stiff pad would load the package. Both are legitimate answers — to different mechanical questions. Ask any supplier which lever they traded to reach the top of their range, and ask for the deflection curve that proves it.
That 16.0 W/mK is also where our own ladder stops: TIF®800TU is the highest grade ZIITEK quotes against D5470. Grades of 17–18 W/mK are sold by other suppliers, so a drawing that specifies one is a signal to compare D5470 records side by side — same method, the pressure and thickness the test was run at, the same through-plane direction — rather than to assume the higher number wins.
One customer reference on that same page puts the arithmetic in context: an AI accelerator HBM interface built with the 16 W/mK pad at 3 mm and 20 psi measured 5–8 °C cooler than the same interface with an ordinary 8 W/mK pad. It is a customer-reported comparison under the stated conditions, not a guaranteed delta — which is how to read any supplier's before-and-after number.
If you are still sizing the nominal thickness from the gap, the arithmetic and the clay-crush measurement method are in the thermal pad thickness and compression guide; this article assumes you already have that number.
Step 3 — Check the electrical and flame envelope
On a server the pad usually sits across a live package, so the electrical envelope is a gate, not a footnote. Look for breakdown voltage per unit thickness (a 15–16 W/mK silicone pad in ZIITEK's 800 series is quoted at ≥5500 V/mm to ASTM D149), volume resistivity, and dielectric constant if the interface runs near a high-speed signal path.
Flame rating is the second gate. UL 94 V-0 is the usual requirement for materials inside a server chassis, and it should be traceable to a yellow-card file rather than asserted in a brochure. A V-0 claim without a file number is a procurement risk, not a technical one.
The third factor is what the pad gives off. Standard silicone pads can bleed low-molecular-weight siloxane, which is harmless to a MOSFET and actively harmful to an optical module facet or a connector. If the interface is anywhere near optics, specify a low-volatility or non-silicone pad and ask for the outgassing data, not a verbal assurance.
A working criterion for the electrical side: derate the quoted breakdown voltage to the thinnest bond line you will actually assemble, keep at least a 2× margin over the highest working voltage that can appear on the net, then take another margin step for thickness tolerance. On a 0.25 mm bond line inside a 48 V system the margin is generous; on a 400 V DC bus it is not, and an insulating carrier film under the pad becomes part of the stack rather than an optional extra.
Step 4 — Lock the assembly parameters
A 16 W/mK pad assembled at half its intended pressure performs like a 6 W/mK pad, and the incoming inspection will never catch it. The parameters that decide the outcome belong in the assembly document:
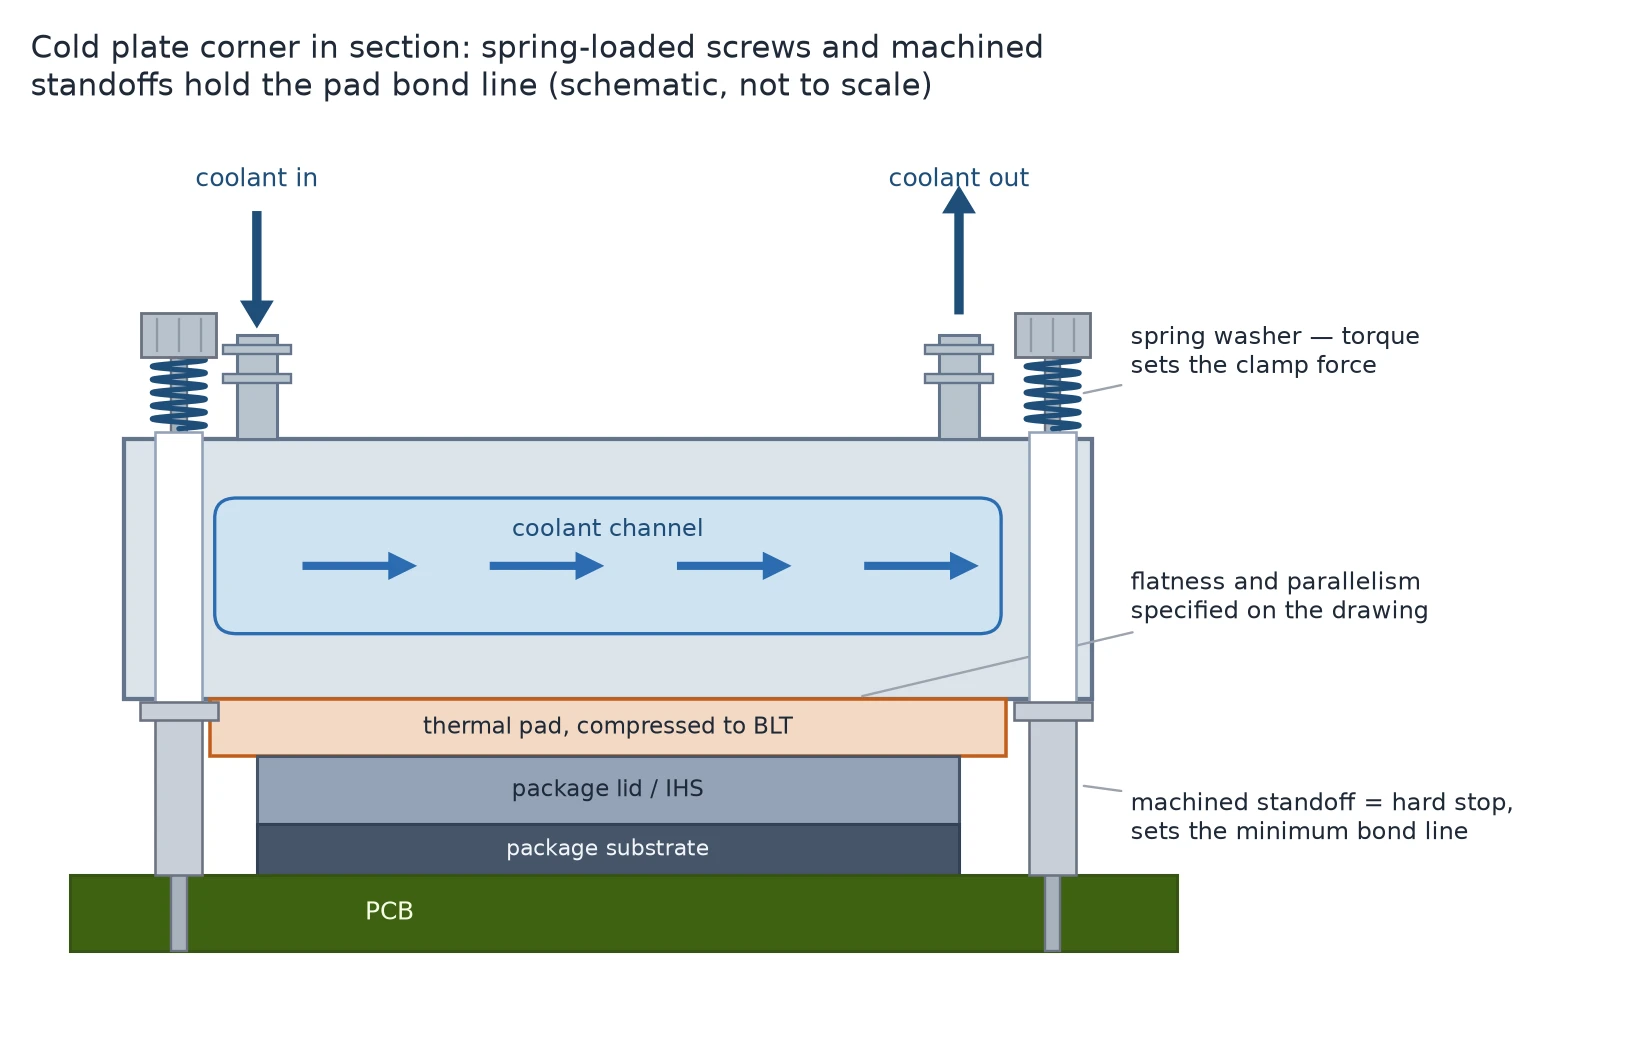
- Pressure and its distribution. A target of 15–30 psi over the pad area is a common band for server pads; what matters more is uniformity. A single central screw bows the cold plate and starves the edges.
- Flatness and parallelism. Machined cold-plate bases typically hold flatness in the tens of microns over the pad footprint; cast or welded parts do not, and the difference shows up as a contact-resistance gradient across the die.
- Gap control. Standoffs or hard stops set the minimum bond line. Relying on the pad itself to define the gap means the bond line is a function of torque repeatability.
- Torque sequence. Cross-pattern, in stages, to the specified value — the same discipline as any clamped interface, and the reason a re-torqued unit often measures better than a freshly built one.
- Rework. A compressed pad that has taken a compression set should be replaced, not reused. Budget the pad as a consumable in the rework procedure, and specify the cleaning step, because a contaminated cold plate will not wet the replacement.
Step 5 — Write acceptance criteria before you qualify
Most pad failures are not caught in qualification; they are caught by a field return two years later. The fix is to define acceptance before the first sample is approved, and to measure during the stress, not only at the end.
| Test | Condition to agree | What it catches | Suggested acceptance |
|---|---|---|---|
| High-temperature aging | 150 °C, 1,000 h | Binder degradation, oil loss | Interface resistance rise ≤ 25%, no cracking |
| Damp heat | 85 °C / 85% RH, 1,000 h | Hydrolytic degradation, bleed | Resistance rise ≤ 25%, no delamination |
| Thermal cycling | −40 to 125 °C, agreed cycle count and dwell | Pump-out, CTE-driven migration | Monotonic resistance trend, no run-away |
| Compression set | 25% deflection, 70 °C, 24 h | Permanent set, loss of contact force | Set ≤ agreed %, force retained |
| Incoming lot | Thickness, hardness, density per lot | Supplier drift between lots | Within datasheet tolerance |
These are the conditions ZIITEK publishes for its own 800-series grades — 150 °C for 1,000 h, 85/85 for 1,000 h, and −40 to 125 °C cycling — which is the level of specificity to expect from any supplier. The limits themselves should come from your thermal budget: a 25% resistance rise on a 0.15 °C·in²/W interface is a very different number from 25% on a 0.30 one.
One practical note on cycling: measure interface resistance or junction temperature during the cycles, in situ, at a fixed power and ambient. End-point measurement hides the slope, and the slope is the early warning. A 20–30% rise in the first thousand hours is the signature of a material that will not make ten years.
Where the pad stops and paste, PCM and gap filler start
Pads win on thick, uniform, serviceable gaps with real clamping force. Outside that envelope, a different format is the better answer, and forcing a pad into it is how programs end up with 3 mm of expensive material doing very little.
| Format | Bond line | Force needed | Rework | Where it wins on a server |
|---|---|---|---|---|
| Thermal paste / grease | 25–100 µm | High clamp | Messy but possible | Bare die or IHS to cold plate, best possible resistance |
| Phase change material | 25–75 µm | Moderate clamp | Moderate | High-flux packages that resist pump-out better than grease |
| Gap filler (dispensed) | 0.1–3 mm | Near zero | Difficult | Variable gaps, no clamping hardware, automation |
| Thermal pad | 0.25–12 mm | Moderate, uniform | Easy | Uniform gaps, insulation, field service |
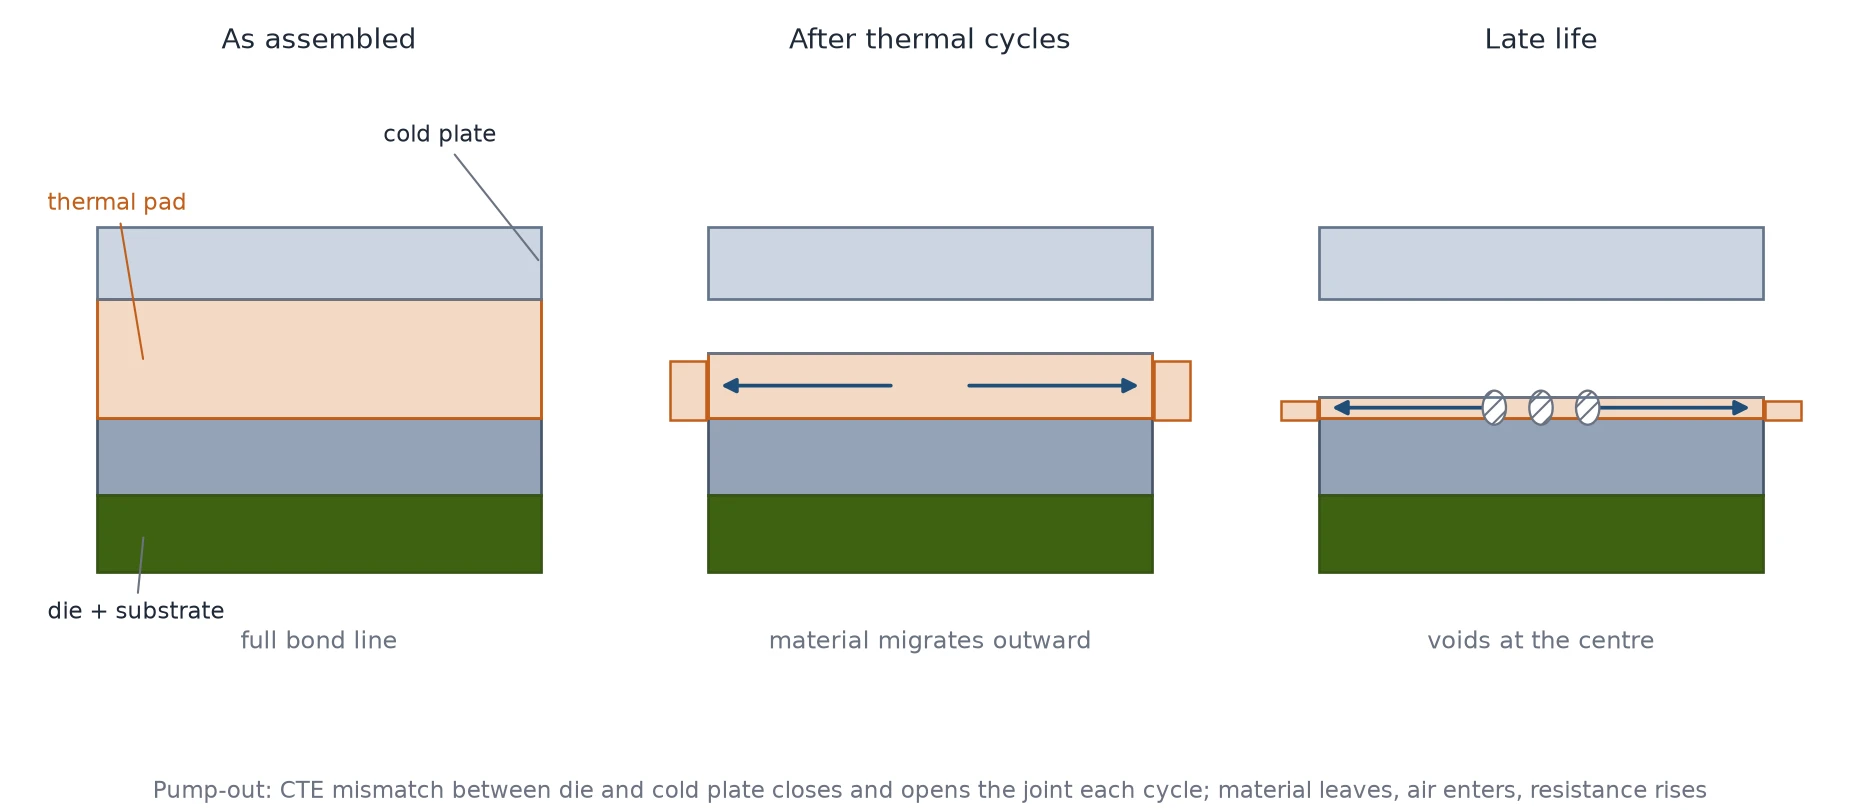
The pump-out risk that dominates grease selection is a mechanical problem, not a chemical one: mismatched expansion between die and cold plate squeezes the material out of the joint cycle after cycle, with no elastic memory to bring it back — the mechanism is described in reliability testing of thermal greases. A pad resists that migration far better because it is a solid, but it trades the risk for compression set and contact resistance at low pressure.
The four-way comparison, including how phase change behaves above and below its transition, is set out in gap filler vs gap pad vs phase change. If you are weighing a liquid-metal interface for the very top of the power range, the trade-offs are covered in liquid metal TIM for data centers — it is a different risk class, not the next grade up.
Failure modes to design out
Pump-out is worth seeing rather than memorising: the joint opens and closes with every power cycle, material that leaves the interface has no elastic memory to bring it back, and the centre of the die starves first.
| Failure | Field signature | Design fix |
|---|---|---|
| Pump-out / migration | Rising hotspot temperature at constant load; material found around the perimeter | Controlled bond line, adequate uniform pressure, prefer a cured or solid format |
| Compression set | Contact force decays after first thermal cycles; gap reopens | Specify compression set, use springs or standoffs that tolerate set |
| Silicone bleed | Oil film on cold plate, fogging near optics, contaminated connectors | Low-volatility or non-silicone pad; outgassing data per lot |
| Over-compression | Cracked die, deformed standoff, pad torn at edges | Hard stops, force limit in the assembly spec, softer grade |
| Insufficient wetting | High resistance at low spots only; gradient across die | Flatness and parallelism targets, softer pad, higher force |
Two of these are procurement problems disguised as material problems: over-compression from an unspecified torque and insufficient wetting from an unspecified flatness. Both are cheaper to fix in the drawing than in the material.
One-page selection checklist
Before the next RFQ goes out, confirm each line has a number or a document behind it:
- Gap window measured on a real assembly, not CAD nominal — min, max and stack-up.
- Required bond line at target compression, and the force your retention hardware delivers.
- Datasheet k quoted to ASTM D5470, through-plane, with the test pressure stated.
- Impedance quoted at your pressure and compression — or a measured R″ from a sample.
- Hardness plus deflection curve, checked against available force.
- Breakdown voltage, UL 94 V-0 with a file number, and outgassing data if optics are nearby.
- Flatness and parallelism targets on the cold plate, in the drawing.
- Torque value, sequence and standoff height in the assembly document.
- Acceptance table agreed: aging, damp heat, cycling with in-situ measurement, compression set.
- Rework procedure that treats the pad as a consumable.
If two or three of those lines are still blank, the grade decision is premature — and the most expensive pad in the catalogue will not rescue it. Send the stack drawing and the gap window to our applications engineers and we will tell you which grade the interface can actually use, or whether a different format is the better answer.